Sensitivity Result Set
Important: The Sensitivity Result Set functions are available in version 16.5 Update 1 and later.
Price and Currency Sensitivities were added in version 16.5 Update 10.
The Sensitivity Result Set implements a sensitivity engine for Planning Space Economics. The sensitivity analysis is configured as a special form of Result Set, and the results of the analysis are captured as a special form of Result Set Run, with the title Sensitivities. The report generated from a Sensitivities run presents the results in the form of Tornado diagrams, Spider diagrams, and numerical tables.
Create a Sensitivity Result Set
In the Result Sets explorer, select the folder where you want to create the result set. Then click the
Add  button on the
ribbon and select Sensitivity Result Set. In the dialog that opens, enter a name and click OK.
The new Sensitivity Result Set will open for editing in a tab.
button on the
ribbon and select Sensitivity Result Set. In the dialog that opens, enter a name and click OK.
The new Sensitivity Result Set will open for editing in a tab.
Note: Result Set names must be unique and the dialog will not accept a name that is already in use.
Select the hierarchy to be used, and the projects that you want to be included using the
Calculation Hierarchy.
You can apply a project filter by selecting a filter name from the dropdown list (no filters are set up by default, select
<No Filter> to remove any filter). This will filter the
projects that are included in the result set calculation, based on variable values. To add or edit the available filters in
the Project Filter Manager dialog, click the Manage Filters
button  on the ribbon.
For version 16.5 Update 7 and later: You can use the Permissions button in the Project Filter Manager dialog to edit access permissions for a filter, based on workgroups and users. When a filter is created, 'Full Access' permissions are granted to the user who created the filter (and to Administrator users). No other users or workgroups are granted permissions by default.
Calculation Options
The settings in the Calculation Options sub-tab are the same as for standard Result Sets, see Standard result set (however there are no Project Sensitivities settings).
There is an option checkbox Select projects to exclude from sensitivities: projects for exclusion can be selected manually from the hierarchy list and/or they can be selected by using a saved filter. Note the default is to exclude no projects.
Sensitivities: Result Variables
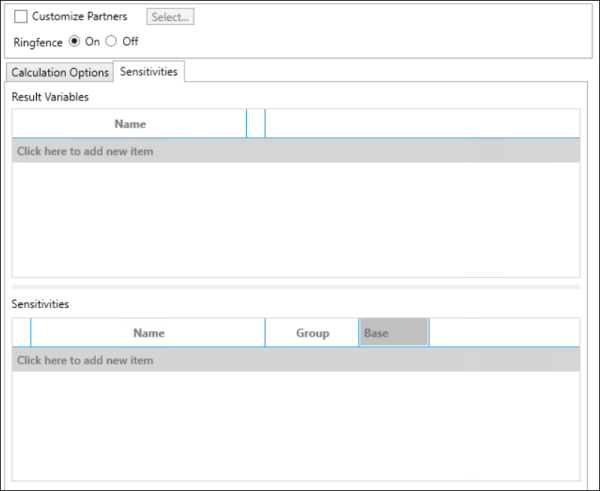
In the Sensitivities sub-tab, you need to add variables in the Result Variables table; these can be selected as individual variables or grouped by variable (sub)categories. Note that Regimes set in the hierarchy are not used to supply any variables information (this is different from the Standard Result Set).
Sensitivities: Project Variables
Sensitivities for variables are configured by adding a set of scenarios in the Manage Sensitivity Scenarios editor: click the Manage Scenarios button on the ribbon to open it. A 'Base' scenario is added by default (which can be renamed or removed). You need to set the order of the scenarios and specify which will be treated as the base scenario for the calculation.
Then, in the Sensitivities table (see screenshot above), you need to add variables either as individual variables or as variable categories. For each variable selection, you need to specify the scenario factors, that is the percentage input for each scenario, relative to the base scenario which is set at 100%.
Grouping
You can edit the text values in the Group column to set up different group names, so that several sensitivities will be treated as part of a group for purposes of calculation and display of results.
Sensitivities: Price and Currency Sensitivities
Price and Currency Sensitivities are available in version 16.5 Update 10 and later.

In the default setting, both sensitivities are enabled, with every scenario set to use the result set's Currency Deck, or Price Deck and Price Scenario, and a Display Factor set to 100.
For Currency sensitivities, click the ellipsis button to edit the settings for each scenario: Currency Deck and Display Factor. A Group name 'Currency' is set and this can be changed.
For Price sensitivities, click the ellipsis button to open the Edit Price Sensitivity dialog and edit the settings for each scenario: Price Deck, Price Scenario, and Display Factor. A Group name 'Price' is set and this can be changed.
For version 16.5 Update 22 and later: The Edit Price Sensitivity dialog has an additional column Prices where you can add sensitivities for price groups in Price Decks.
Click the ellipsis button in the column, which opens the Select Price dialog: in the dialog select one or more price groups, and for each price set the sensitivity value in the Sensitivity (in %) column. Click OK to save these settings; the Prices column will summarize the settings. To edit the settings, re-open the dialog by clicking the ellipsis button.
Sensitivities: Term Variables Sensitivities
Term Variables Sensitivities are available in version 16.5 Update 13 and later.
Export and Import of Sensitivities settings
For version 16.5 Update 13 and later: The Sensitivities settings (i.e., the contents of the Sensitivities tab) can be exported to an external file (XML format) using the Export Sensitivities button on the ribbon. Settings can be imported from a file using the Import Sensitivities button.
Importing will overwrite all of the settings in the currently-selected result set. At the end of the import a message will inform you if the import was successful, or if there were elements that could not be imported, for example, because a necessary regime or currency deck is not present; the import will not stop in the case of missing elements.
Run the sensitivity calculation
When the configuration is complete, click the Calculate  button on the ribbon. The results of the sensitivity calculation will be stored as a special form of result set run that is always named 'Sensitivities'.
Sensitivity report
The report that is generated will consist of Tornado diagrams, Spider diagrams, and a numerical table.
Open the 'Sensitivities' run (it must have a green tick signifying successful calculation) inside the Sensitivity Result Set folder (use right-click and select Open, or use the Open button in the Home tab on the ribbon).
In the Calculation Hierarchy, select the folders and projects that you want to be included in the report.
Indicator variables
In the Sensitivities sub-tab, you need to add the Indicator Variables to be included, and for each variable to specify the Indicator ('Sum', 'Average', 'IRR', 'NPV @ Discount Rate'). The Alias is a label that will be used in the report output; you will need to set this appropriately if you are going to save any of the results.
For version 16.5 Update 17 and later: The Indicator variable selector includes the Discount Rate information taken from the configured Currency & Discounting preset. This removes the need to do a separate lookup for information when configuring the Aliases.
For version 16.5 Update 13 and later: The Indicator Variables settings can be exported to an external file (XML format) using the Export Indicators button on the ribbon. Settings can be imported from a file using the Import Indicators button.
Importing will overwrite all of the settings for the currently-selected Indicator Variables table. At the end of the import a message will inform you if the import was successful, or if there were elements that could not be imported; the import will not stop in the case of missing elements.
Results output
Click the Generate Report  button. The report
output should appear in the Results sub-tab.
button. The report
output should appear in the Results sub-tab.
For version 16.5 Update 24 and later: In the Results tab for a generated report, the Table sub-tab has the buttons Increase Decimals and Decrease Decimals which can be used to control the decimal precision of displayed variables in the table and chart outputs. The default setting is 2 decimal places, with minimum of 0 and maximum of 8 decimal places.
Tornado and Spider diagrams
There are three sub-tabs Tornado, Spider, and Table.
For the diagrams, use the Alias selector at the top-right corner of the tab to select the diagram for each Indicator Variable. There are zoom and reset controls at the top-right corner of the diagram.
The diagram horizontal scale can be set as Actual Values, Actual Diff or Percent Diff (default), using the radio buttons at the bottom of the diagram.
Use the Save as (download) button to save diagrams as PNG files, or the table as CSV data.
For version 16.5 Update 2 and later: Partner names are included in labels and headings in the diagram and table outputs, if a partner has been selected for the report generation. (The label format is the same as used in Standard result set outputs.)